Factory spending more than doubled. Output stayed flat.
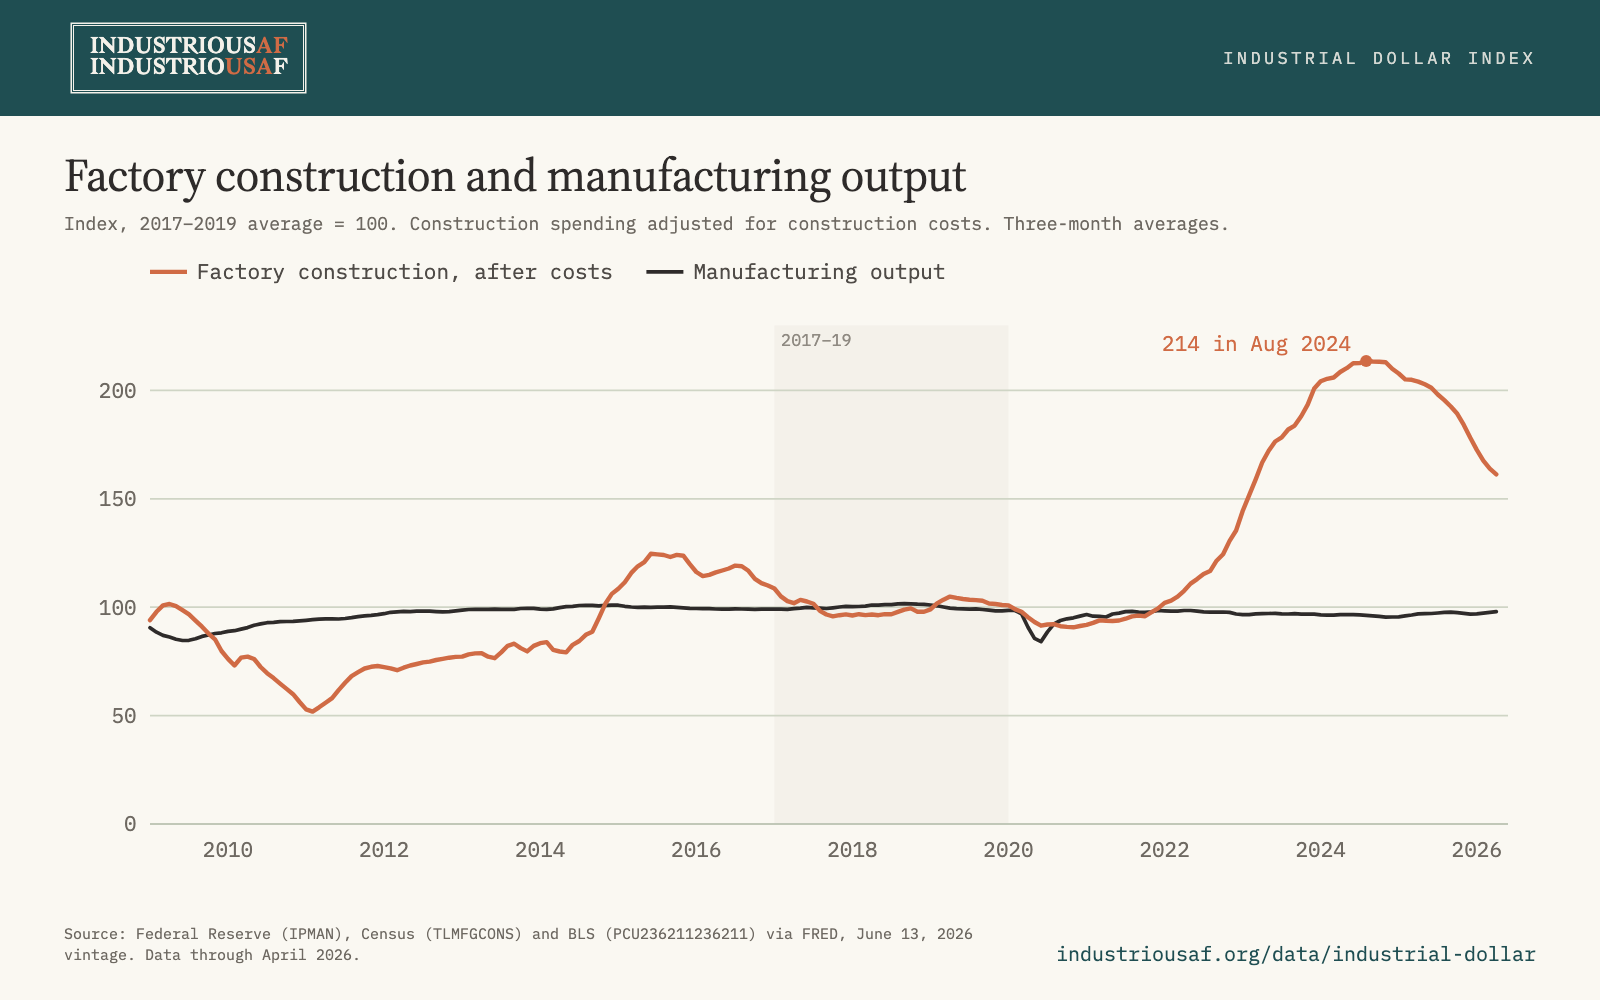
After construction costs, spending on new factories peaked in August 2024 at more than twice its 2017–2019 level. Manufacturing output has stayed within a few points of where it was.
Factory construction and manufacturing output
Index, 2017–2019 average = 100. Construction spending adjusted for construction costs. Three-month averages.
Source: Federal Reserve (IPMAN), Census (TLMFGCONS) and BLS (PCU236211236211) via FRED, June 13, 2026 vintage. Data through April 2026.Save image
The Industrial Dollar
Each dollar of factory spending buys less output.
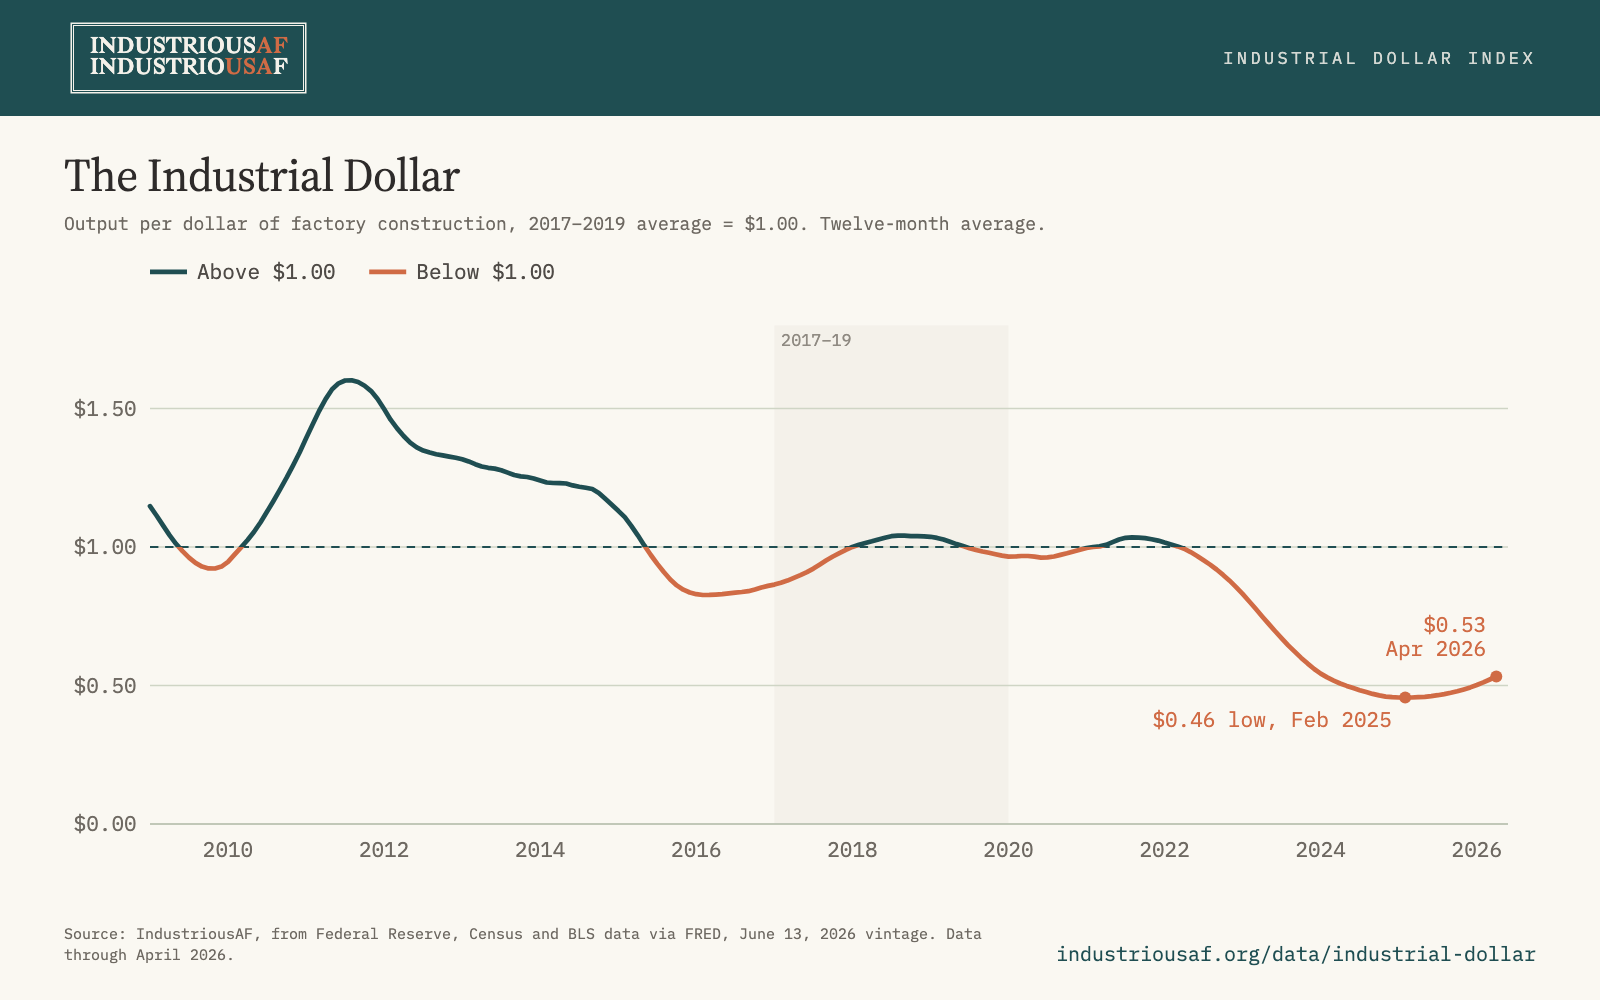
Divide output by factory spending and you get the Industrial Dollar. Before the pandemic it read about $1.00. It hit a low of $0.46 in February 2025.
The Industrial Dollar
Output per dollar of factory construction, 2017–2019 average = $1.00. Twelve-month average.
Source: IndustriousAF, from Federal Reserve, Census and BLS data via FRED, June 13, 2026 vintage. Data through April 2026.Save image
Where the money went
Most of the new money went into chip and electronics plants.
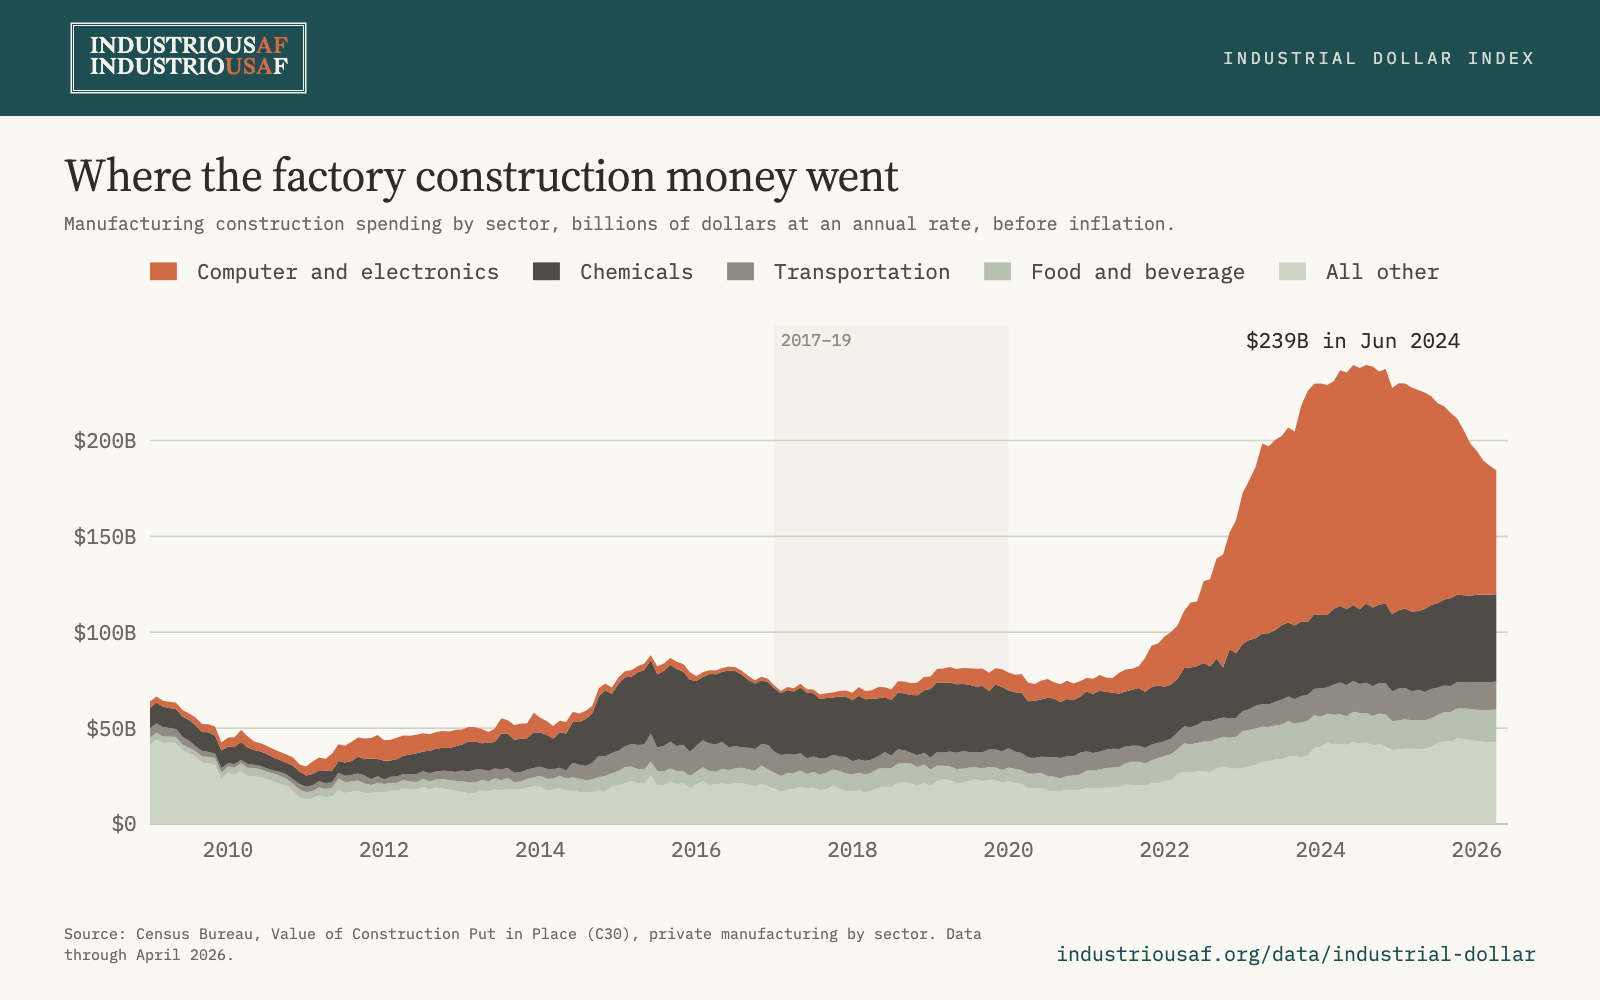
Between 2019 and the June 2024 peak, three of every four added dollars went to computer and electronics construction, driven by the CHIPS Act. A chip fab takes three to five years to go from groundbreaking to full output, and it needs experienced workers who are scarce in the U.S.
Where the factory construction money went
Manufacturing construction spending by sector, billions of dollars at an annual rate, before inflation.
Source: Census Bureau, Value of Construction Put in Place (C30), private manufacturing by sector. Data through April 2026.Save image
Allies
Six allies show the same drop.
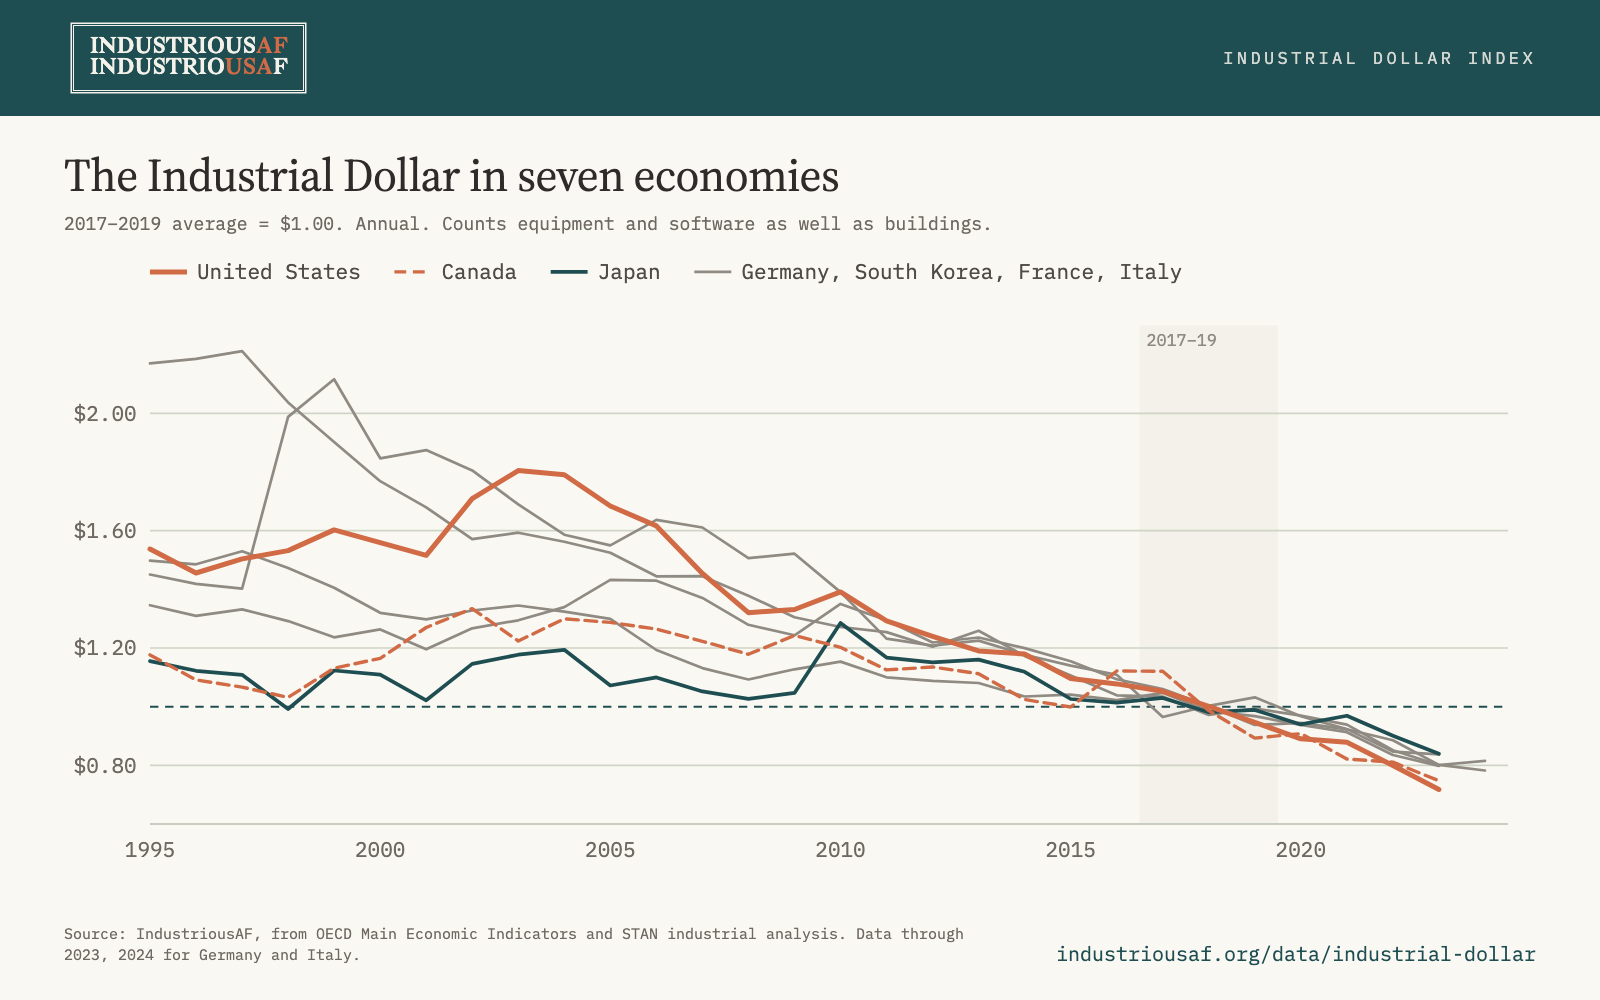
Run on OECD data, the index also falls after 2020 in Germany, Japan, South Korea, Canada, France and Italy. The United States and Canada fell furthest, and Japan the least. The OECD version counts equipment and software along with buildings, which is why its U.S. drop is smaller than the headline reading.
The Industrial Dollar in seven economies
2017–2019 average = $1.00. Annual. Counts equipment and software as well as buildings.
Source: IndustriousAF, from OECD Main Economic Indicators and STAN industrial analysis. Data through 2023, 2024 for Germany and Italy.Save image
Next
What we are building next.
A forecast. Use the index to flag which committed factory investments are on track to produce and which are stalling.
Worker experience. Add a measure of experienced and newly hired workers, to test whether a shortage of experienced workers explains the drop.
Plants as they open. Count new factories when they start producing, so a building boom stops pulling the reading down by itself.
Sector by sector. Separate readings for chips, autos, chemicals and everything else.
Forty years of history. Extend the index back to the mid-1980s.
Deeper allied comparisons. Compare how each ally invests in plants and trains its workers, starting with South Korea and its decades of fab building.
Limits
What the index leaves out.
It tracks spending on plants being built. A low reading says nothing about how hard existing factories run.
The headline counts buildings only. The OECD version adds equipment and software, and it shows a smaller U.S. drop.
Readings run high when little is being built and low during a building boom, because spending sits in the denominator.
The Census Bureau revises recent construction spending, so the latest reading can move by a cent or two.
The paper
The full method is in the paper.
It has the data sources, all eight figures, the comparison with official productivity statistics and the research plan behind the list above. Read it on SSRN.